iChart is the market companion that connects your watchlist to the economic calendar. Open any asset and you'll see dashed markers at the exact moment a scheduled event happened — with the price move that followed, computed live from your own chart.

For recurring events — an ECB rate decision, a US jobs report, an FOMC statement — iChart tracks how your specific asset has historically reacted, and surfaces it right on the chart.
ExampleLast 8 ECB rate decisions → EURUSD: median move ±0.42% within 30 min, 6 of 8 continued in the same direction after 4 hours.
These stats build up from the app's own observations over time. Until there's enough history for a given asset and event, iChart says "still tracking" instead of inventing a number. No fake data, no back-fitted claims — just what actually happened on your chart.
Available on iPhone.

Open any asset's candlestick chart and you'll see dashed markers at the exact moment a relevant scheduled event went live. Tap a marker to see its forecast and previous values — and the actual price move in the 30 minutes that followed, computed live from the chart itself.

Every scheduled event that could have moved this asset lands as a marker on the chart — no digging through a separate feed.

Each marker opens the event's headline number and the real price move in the following 30 minutes on your chart.

High-impact events shade a translucent band around the ±30-minute window so you can see the volatility spike at a glance.
Available on iPhone.
iPhone isn't a mirror of the Watch app — it's where iChart is at its most expressive. Live watchlist rows with sparklines, a full candlestick chart you can pinch to zoom, drag to pan, and tap to inspect OHLC. Drag rows to reorder. Sort manually, alphabetically, or by % change.

Crypto, stocks, forex and indices in one list — with a per-row sparkline, current price and % change, color-coded by category.

Real candlesticks with 15m/1h/1D/1W timeframes. Pinch to zoom, drag to pan, tap any candle for precise OHLC — event markers included.

Set a heads-up an hour ahead and a final nudge minutes before — and choose how many live countdowns run at once.

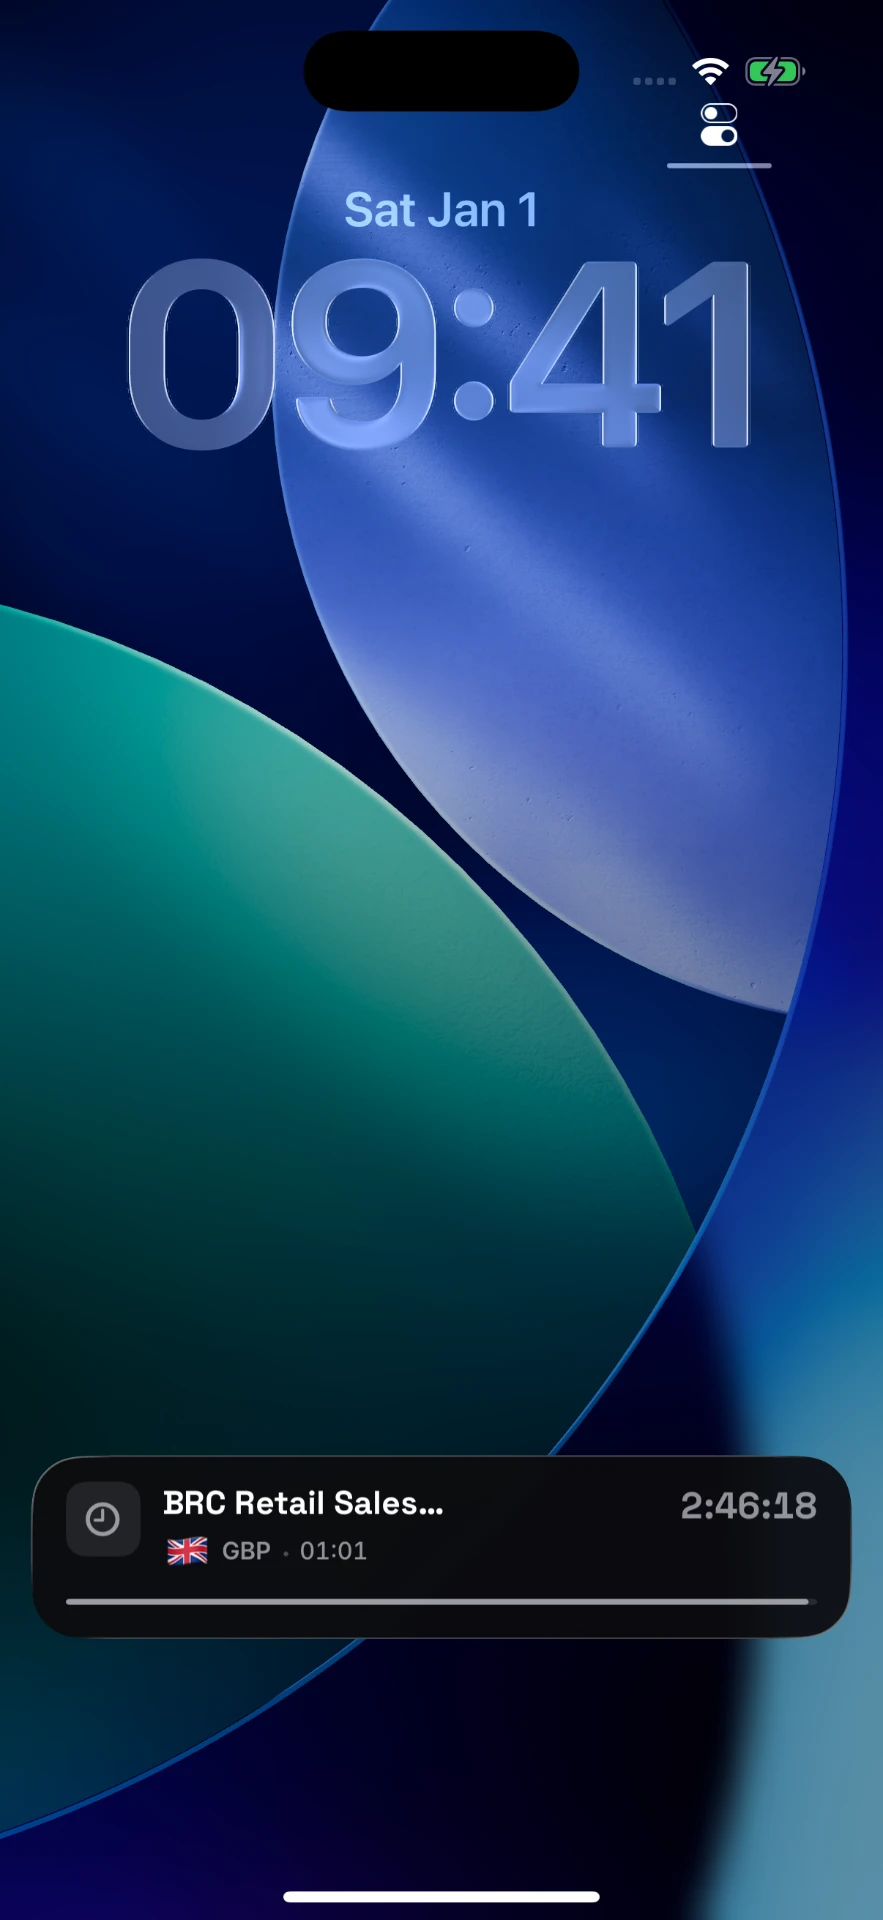
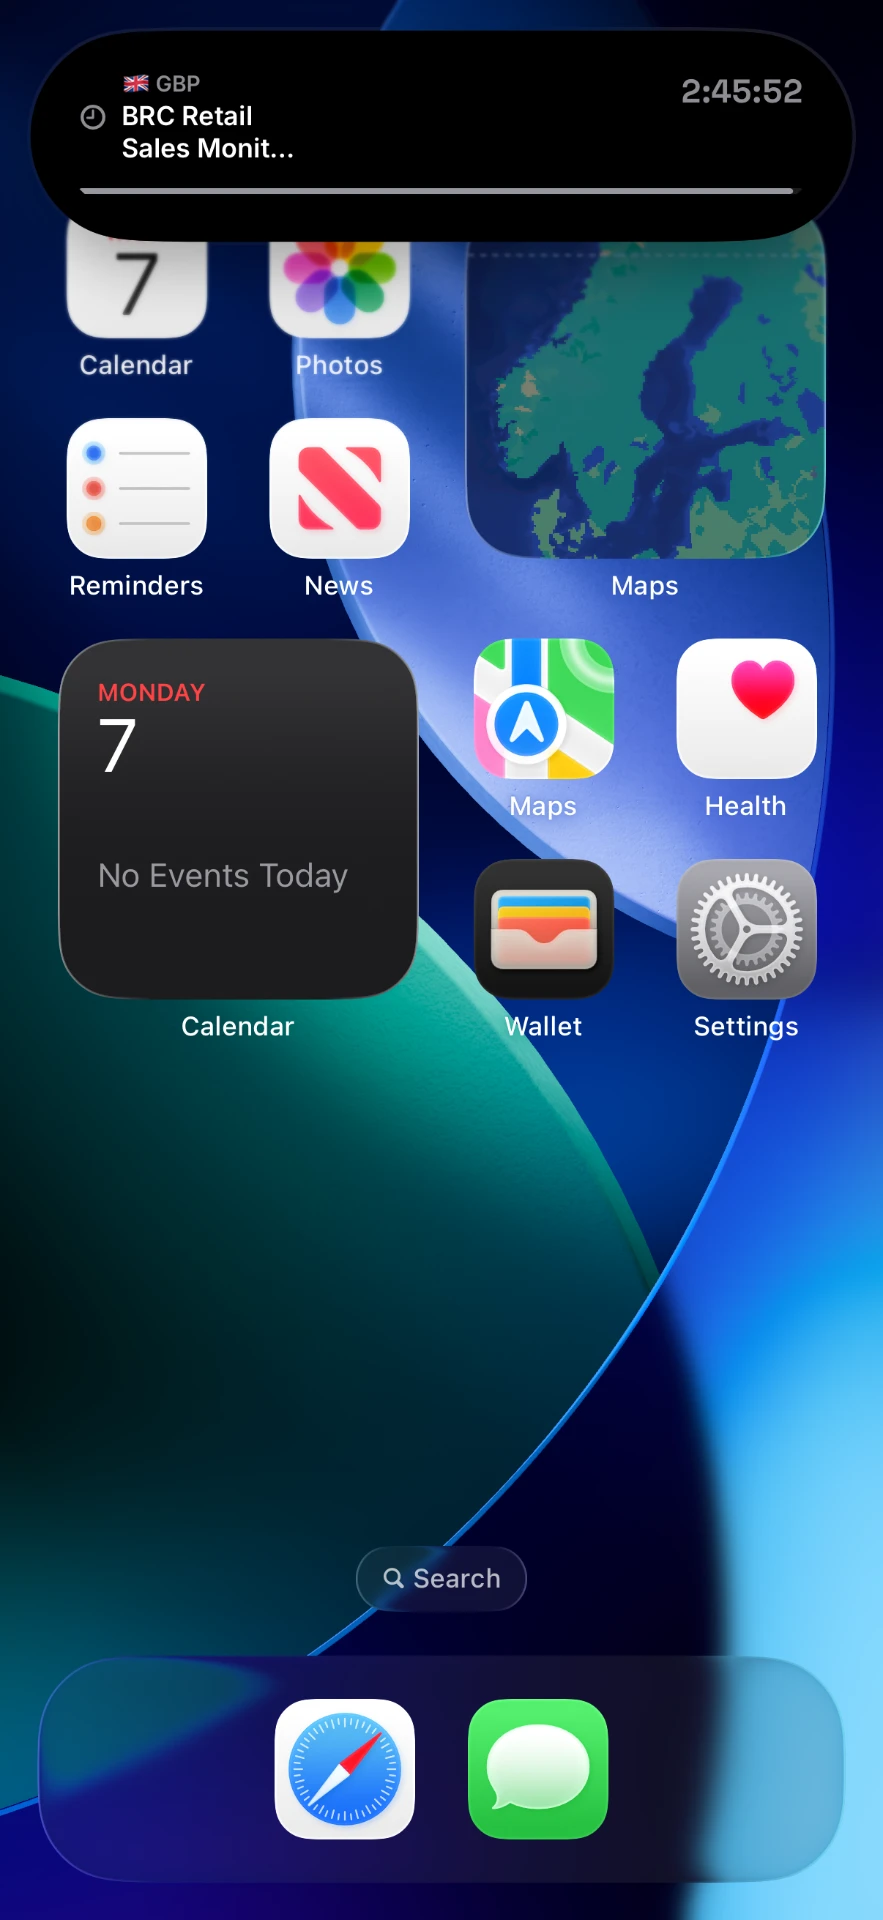
An alerted event runs as a Live Activity on your Lock Screen and in the Dynamic Island, with the assets it affects listed inline.
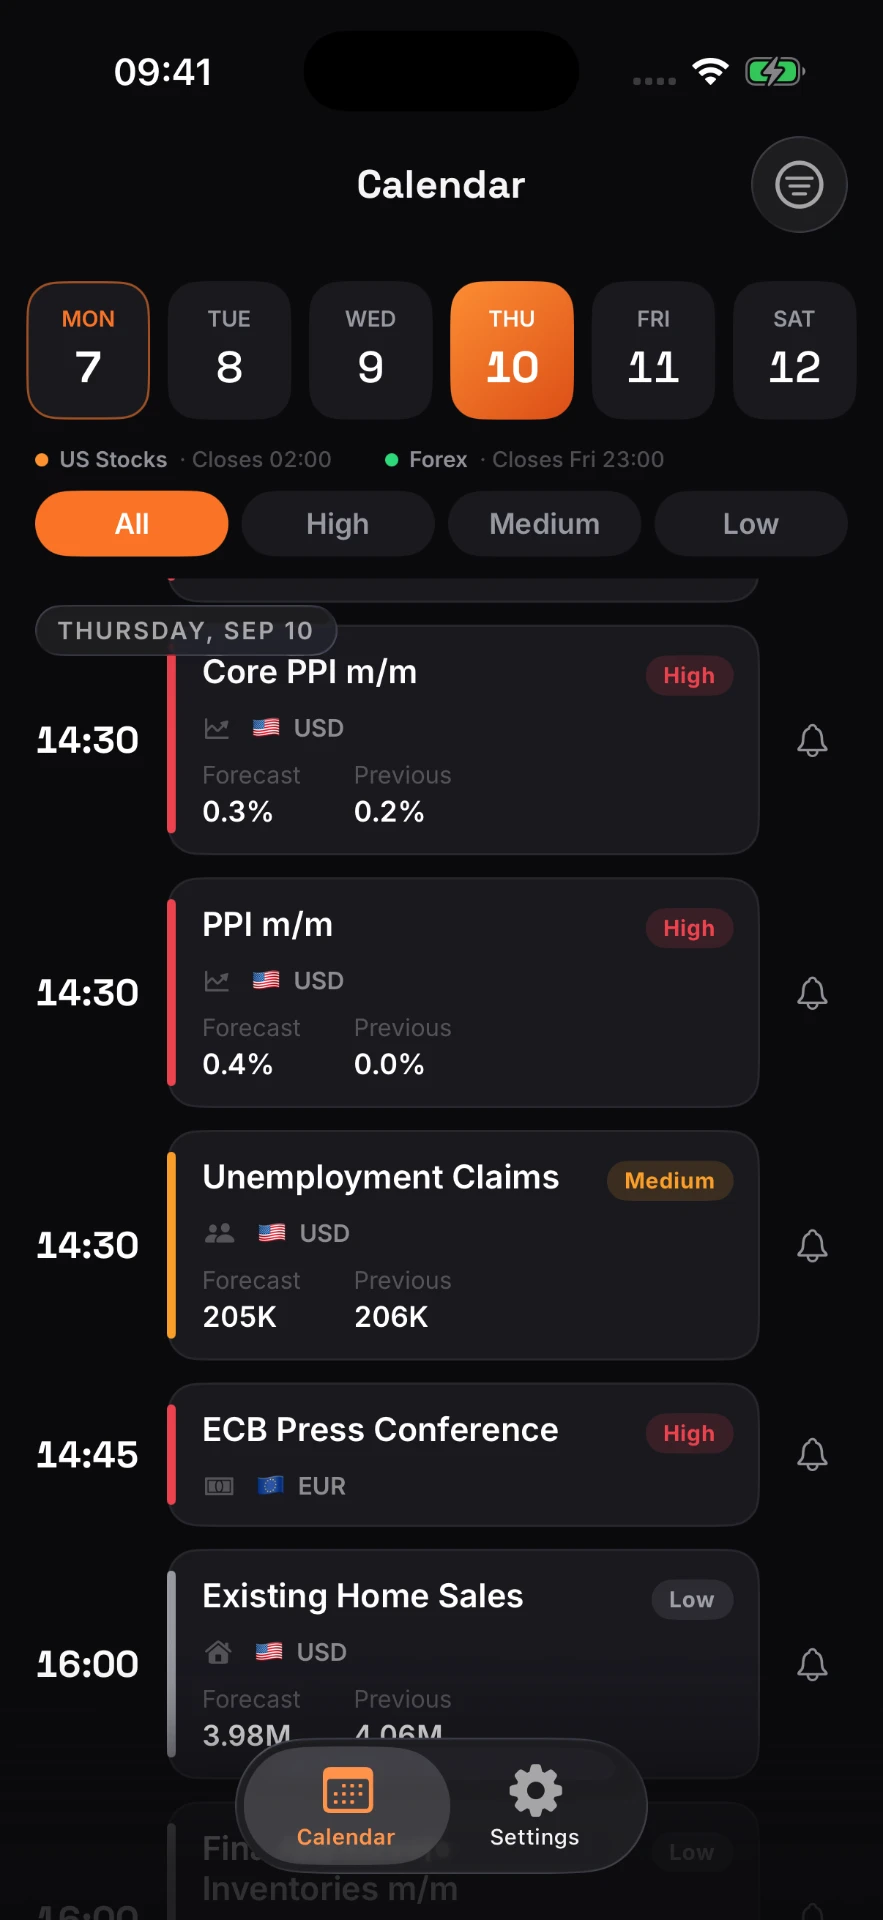
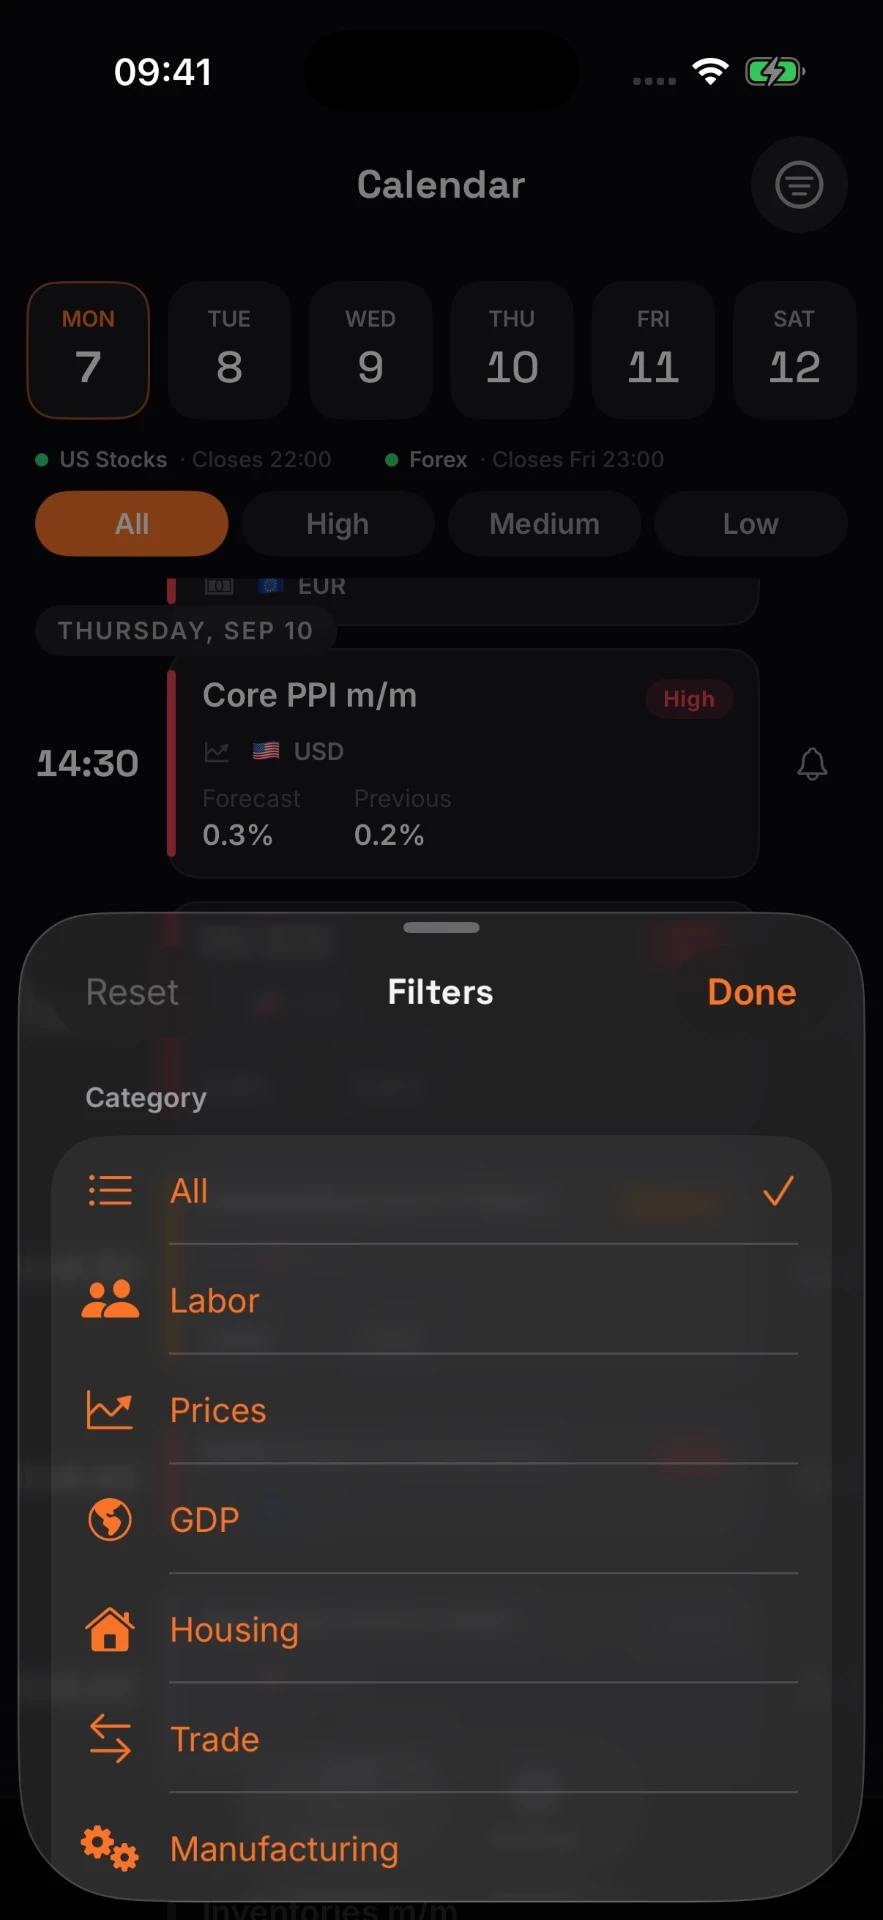
CPI, FOMC, NFP, ECB, central-bank speakers — all in a clean, filterable calendar. Filter by impact and country, then tap the bell to get a local reminder before an event goes live.
Event alerts don't just say "High-impact EUR event in 15 min" — they say "affects 2 of your assets". iChart cross-references the event against your watchlist so only the ones that matter to you interrupt you.


Every event in the calendar becomes a marker on the chart of an affected asset. Tap through and you go from a generic reminder to a concrete number, on your own price history.
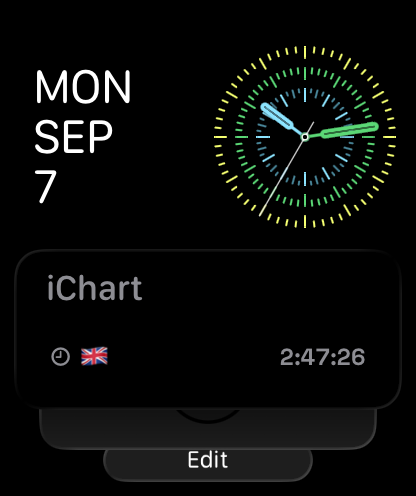
Pin the assets you actually care about and keep them a glance away — on your Home Screen and on your watch face.


A native watchOS app with your watchlist, real candlestick charts, swipe actions and the economic calendar. Use the Digital Crown to scrub through candles and inspect OHLC — right on the wrist.

Your assets, always up to date, always one raise-to-wake away.

15m, 1h, 1D, 1W and more. Volume bars, price axis and last-updated indicator — rendered natively.

Turn the Crown to scrub through candles and reveal open, high, low and close for the exact timestamp.

Scroll upcoming events by day, spot the high-impact ones at a glance, and set a reminder without pulling out your iPhone.

Keep your most-watched tickers at the top. Reorder your watchlist without ever leaving the wrist.

Remove assets you no longer follow with a familiar swipe gesture.
Add tickers from crypto, stocks, forex and indices. Crypto prices are powered by Kraken. Stocks, forex and indices are powered by Yahoo Finance. Economic events are sourced from ForexFactory.
iChart doesn't ask you to sign in and doesn't collect personal information. Your watchlist lives on your device. That's it.